Unlike other reporting tools, Network Detective Pro gives you the power to control the output.
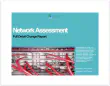
 You decide which reports you want to run. You brand them with your company logo, your contact info, your colors and your choice of image and layout. You can even edit and customize them to your heart’s content.
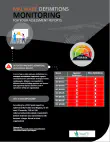
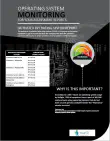
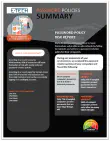
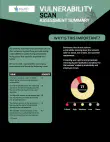
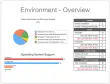
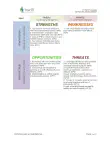
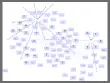
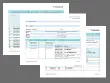
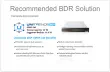
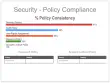
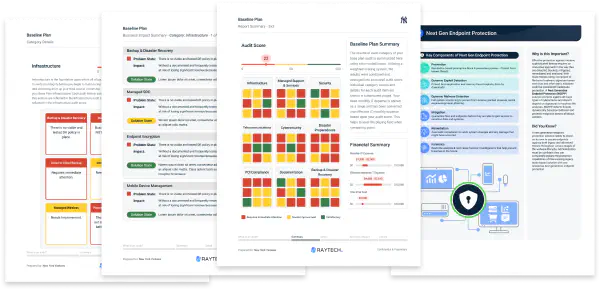
Choose from a wide range of technical reports that can be automatically generated and scheduled to be produced and distributed to anyone you like on any schedule you set up. These customizable reports give you the ability to document and showcase the health and performance of the networks you manage.
To make it easy, we organize our reports in two different ways: You can view reports by the type of assessment you are running, such as Network, Security, Exchange, SQL Server or MS Cloud, or you can view them by use case.
Fill out the form at right, and you’ll be redirected to our Sample Reports page to download samples of any of our reports. The sample reports we provide are take from actual network environments, with the data anonymized for the purposes of privacy.
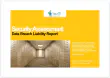
Want to download a sample of any report that Network Detective Pro can automatically generate? Fill out the form on this page to gain access.
Fill out the form below to gain instant access to samples of each of the reports that can be generated with Network Detective Pro.
![]() |
Client Risk Report. This is the "money" report for you. The report presents your client with a summary of their overall risk score based on your scan, along with simple charts to show the problem areas. Each problem area represents an opportunity for you to present a proposed solution and pitch your services. The purpose of this report is for you to use as a "discussion document" to aid you in having a conversation with your customer about the specific risk areas you found, what they mean, and how you can help. Keep the Full Network Assessment in your hip pocket, and pull it out when your prospective new client asks how you came up with your findings! |
![]() |
Network Management Plan. This report will help prioritize issues based on the issue's risk score. A listing of all affected computers, users, or sub-systems are provided along with recommended actions. |
![]() |
Full Detail Report. Our scan will pull out literally hundreds of pages of end-user network activity and configuration data. The Full Network Assessment Report includes every detail, presented in line-item fashion in an editable report document. The report is organized by section with a table of contents to help you locate the specific findings of interest, and problem areas are conveniently highlighted in red, making it easy to spot individual problems to be rectified. |
![]() |
Network Assessment PowerPoint. Use our generated PowerPoint presentation as a basis for conducting a meeting presenting your findings from the Network Detective. General summary information along with the risk and issue score are presented along with specific issue recommendations and next steps. |
![]() |
Site Diagram. Once you sign up for Network Detective and run a scan, you'll have the option to generate a site diagram which breaks down and categorizes all of the assets available on the network. The schematic shows the basic network structure, with convenient drill downs into each group of like workstations. Each device is annotated with important identifying configuration information and is color-coded based on its status. |
![]() |
Asset Detail Report. Asset Detail Report - For each network scan, this report provides detailed information on each of the individual assets discovered by Network Detective Pro. The report is ideal for cataloging and documenting the complete settings and configurations for individual workstations and servers, including details on Windows, Mac, and Linux devices. |
![]() |
Full Detail Change Report. Everyone knows that a computer network is a dynamic environment and as such is constantly changing. And a Network Assessment is only a snapshot of the network status at the time the assessment is run. That's why we include a valuable Network Assessment Comparison Report. Every time you run an assessment on a given network, the software generates a unique encrypted data file containing all the findings. Network Detective allows you to generate a report that compares the results of any two network scans, and highlights everything that has changed. |
![]() |
Excel Analysis Export/Report. We also give you the ability to output all of the assets and configurations uncovered by our scan, and export it into an Excel file format. Once in Excel, you'll be able to take the data and import it into your favorite Service Desk or PSA system, or simply create your own custom sorts, analyses, reports and graphs inside of Excel. Add columns of new data such as location info, emergency phone numbers, and customer instructions to make this report even more valuable. |
![]() |
Quarterly Business Review Report. This report compares one time period to a previous one forming the basis for a Quarterly Business Review meeting. It centers on changes rather than detailed data and shows overall trending. Use this report to encourage "face-to-face" meetings and improve stickiness with your customers. |
![]() |
Response Report. Response Reports can be generated from any InForm form. These reports allow you to present data entered into InForm from the pre-built forms or from your own forms. |
![]() |
IT SWOT Analysis. Embellish your IT assessments with site photos, policies, and additional information you collect from client interviews & on-site inspections. The Network Detective In-Form tool is included with all Module subscriptions. Use it to create IT check-lists, questionnaires, and IT SWOT Analyses. |
![]() |
Layer 2/3 Diagram Report. Completely visualize how everything is connected! This high-level report shows a layer 2/3 diagram and mapping with section blow-ups that list all major network devices, and segmented diagrams of connected devices. Additional information is also provided to identify which operating systems and device types were found. |
![]() |
Layer 2/3 Detail Report. Detailed and accurate information on network devices and what's connected to them. Links connected computers, printers, and other devices to the actual switch ports they are connected to. |
![]() |
Layer 2/3 Detail Excel Report. The same information as in the Layer 2/3 Detail Report, but in Excel file format. Once in Excel, you'll be able to take the data and import it into your favorite Service Desk or PSA system, or simply create your own custom sorts, analyses, reports and graphs inside of Excel. |
![]() |
Layer 2/3 Diagram Image. We provide you with a 10 megapixel PNG image that can be viewed on-screen or printed on a plotter. The image can also be incorporated into other documents or further enhanced with notation. |
![]() |
Datto BCDR Needs Analysis Report. An automated analysis for quickly scoping out the on-premises back-up requirements for any existing client or prospect and generating a dynamic proposal with details of the recommended Datto solution. The report includes a recovery time calculator, and summary information on servers and workstations |
![]() |
UniTrends BDR Analysis . An analysis of the backup needs for servers, workstations, and cloud applications on the network. |
![]() |
UniTrends BDR PowerPoint. PowerPoint presentation showing a summary of the backup needs for servers, workstations, and cloud applications on the network. |
![]() |
Windows Service Account Report. This report details the Windows Service Accounts discovered in the target environment. |
![]() |
Cyberattack Risk Assessment. The Cyberattack Risk Assessment Report presents a high-level overview of the security posture of the computers tested for the report. It includes a one-page graphical executive summary that includes results from 9 threat vectors including: System Configuration, Applications, Endpoint Protection, Patching, Encryption, Sensitive Data, Network, User Behavior and External Threats. It also includes a dollar estimate of liability in the event of a breach, and top five risks. The report also provides supporting details for discovered issues and plain-English explanations of the nature of the risk and implications of the vulnerability. |
![]() |
Security Risk Report. This report includes a proprietary Security Risk Score and chart showing the relative health (on a scale of 1 to 10) of the network security, along with a summary of the number of computers with issues. This powerful lead generation and sales development tool also reports on outbound protocols, System Control protocols, User Access Controls, as well as an external vulnerabilities summary list. |
![]() |
Security Management Plan. This report will help prioritize issues based on the issue's risk score. A listing of all security related risks are provided along with recommended actions. |
![]() |
Client Progress Report. The Progress Report allows users to showcase the health of the IT infrastructure. Information is delivered through easy-to-follow charts that illustrate the continuous improvements to the security profile of the business and can validate the need for additional resources. Users can customize the documents by including or excluding sections, changing text, and adding boilerplates. The Progress Report is available for users with subscriptions to the Network Detective Pro. |
![]() |
Security PowerPoint. Use our generated PowerPoint presentation as a basis for conducting a meeting presenting your findings from the Network Detective. General summary information along with the risk and issue score are presented along with specific issue recommendations and next steps. |
![]() |
Data Breach Liability Report. Identifies specific and detailed instances of personal identifiable information (PII) and cardholder data throughout a computer network that could be the target of hackers and malicious insiders. It also calculates the potential monetary liability and exposure based upon industry published research. |
![]() |
External Vulnerabilities Scan Detail Report. A comprehensive output including security holes and warnings, informational items that can help make better network security decisions. This is an essential item for many standard security compliance reports. |
![]() |
External Vulnerability Scan Detail by Issue Report. A more compact version of the External Vulnerability Scan Detail report that is organized by issues. Devices that are affected are listed within an issue. This report is useful for technicians that are looking to resolve issues, rather than performing remediation on a particular system. |
![]() |
External Network Vulnerabilities Summary Report. This report provides a priority ordered listing of issues by CVSS that allows technicians to prioritize the issues they are working on. It provides an extremely compact view of all issues allow a quick survey of the various issues that were detected in an environment. |
![]() |
Outbound Security Report. Highlights deviation from industry standards compared to outbound port and protocol accessibility, lists available wireless networks as part of a wireless security survey, and provides information on Internet content accessibility. |
![]() |
Security Policy Assessment Report. A detailed overview of the security policies which are in place on both a domain wide and local machine basis. |
![]() |
RSOP Computer Settings Report. This report analyzes the various Resulting Sets of Policy (RSOP) based on computer policy settings on computers in the environment and can be used to assess how many variants of settings exist in a network. Small variants might be a result of misconfiguration of misapplication of Group Policies at the computer level. Use this report to demonstrate how you might be able to create consistent policies or avoid one-off settings and misconfigurations that lead to inconsistent security policy application. |
![]() |
RSOP User Settings Report. This report analyzes the various Resulting Sets of Policy (RSOP) based on user policy settings on computers in the environment and can be used to assess how many variants of settings exist in a network. Small variants might be a result of misconfiguration of misapplication of Group Policies at the user level. Use this report to demonstrate how you might be able to create consistent policies or avoid one-off settings and misconfigurations that lead to inconsistent security policy application. |
![]() |
Share Permission Report by Computer. Comprehensive lists of all network "shares" by computer, detailing which users and groups have access to which devices and files, and what level of access they have. |
![]() |
Share Permission Report by User. Organizes permissions by user, showing all shared computers and files to which they have access. |
![]() |
User Behavior Analysis Report. Shows all logins, successful and failure, by user. Report allows you to find service accounts which are not properly configured (and thus failing to login) as well as users who may be attempting (and possibly succeeding) in accessing resources (computers) which they should not be. |
![]() |
Login History by Computer Report. Same data as User Behavior but inverted to show you by computer. Quite useful, in particular, for looking at a commonly accessed machines (file server, domain controller, etc.) – or a particularly sensitive machine for failed login attempts. An example would be CEO's laptop – or the accounting computer where you want to be extra diligent in checking for users trying to get in. |
![]() |
Login Failures by Computer Report. This report provides a list of systems that have had failed interactive and network login attempts along with a count of the number of failed logins over the past 1, 7 and 30 days. Use this to identify an employee who has forgotten their credentials. In an extreme scenario, the report may help you detect a hacker trying to enter the network through an employee's legitimate account, or an attempt to access a highly sensitive system such as the CEO's workstation. |
![]() |
Anomalous Login Report. Expand your security know-how and easily identify anomalous user logins with a value-add report that methodically analyzes login history from the security event logs. The report uses mathematical modeling and proprietary pattern recognition to highlight potential unauthorized users who log into machines they normally do not access and at times they normally do not log in. This report delivers a security professional focus and pinpoints a manageable set of logins to investigate. |
![]() |
Health Report. This report details the overall risk to the environment measured by the number of issues detected. An ideal environment would have a Health Score of 0 (indicating no risks found). The higher the score, the more likely a security, availability, or performance related incident will occur. |
![]() |
AWS Assessment Change Report. AWS Assessment Change Report - This report is a very detailed technical report that identifies infrastructure and configuration changes. This is useful for change management and for capturing and documenting unwanted changes in the event you need to roll back those changes in the user interface. |
![]() |
AWS Assessment Excel Report. Amazon Assessment Excel Report - We provide users the ability to export the results of the Amazon Assessment into an Excel file format, all of the Amazon AWS Assessment information discovered from the scans. Once in Excel, you'll be able to take the data and import it into your favorite Service Desk or PSA system, or simply create your own custom analyses and graphs inside of excel. Add columns of customized data to make this report even more valuable. |
![]() |
AWS Assessment. AWS Assessment - The Amazon Web Services Assessment report documents all aspects of AWS Infrastructure with this expansion of our Cloud Assessment technology. This report allows Network Detective Pro users to collect and report on assessment data from Amazon Web Services including Ec2, VPC and RDS just to name a few. |
![]() |
MS Risk Report. The MS Risk Report is similar the Risk Reports in all of our other Network Detective modules, except it covers Azure AD and the key Microsoft 365 (formerly Office 365) services. It includes an overall Risk Score, an overall Issues Score, as well as a summary list of issues discovered. The issues come from both the Microsoft controls and other best practices. This Risk Report identifies specific risks that are due to misconfigurations, as well as risks created from turning on or off specific running components. |
![]() |
MS Management Plan. The MS Management Plan takes issues identified in the Risk Report, organizes them by severity, and includes specific recommendations on how to remediate them. The report’s information is pulled directly from the Microsoft controls from multiple Microsoft 365 services, including SharePoint, OneDrive, Teams, and Azure AD itself. It also identifies other types of issues related to misconfigurations and operations. |
![]() |
MS Cloud Security Assessment. The MS Cloud Security Assessment report brings together all of the security aspects of Microsoft Cloud under one umbrella. It not only includes your own Microsoft Control Score and Secure Score from Microsoft; it also shows your trending against the average score of your peers. The report also details vulnerabilities in the configuration and usage of Microsoft Windows Defender ATP. |
![]() |
MS Azure AD Assessment. The MS Azure AD Assessment goes through the entire Azure Active Directory environment and documents all organizations, domains, and support services that are turned on for the AD environment. Every detail is presented in line-item fashion in an editable report document, including installed special applications, web URLs to those apps, organizational contacts, distribution lists, proxy addresses, Microsoft service plans and SKUs being used, groups, users, permissions, devices, and more. The report is organized by section with a table of contents to help you locate the specific findings of interest, and problem areas are conveniently highlighted in red, making it easy to spot individual problems to be rectified. |
![]() |
MS Azure AD Assessment Excel Export. We provide MSPs the ability to export into an Excel file format all of the MS Azure AD Assessment information discovered from the scans. Once in Excel, you'll be able to take the data and import it into your favorite Service Desk or PSA system, or simply create your own custom analyses, reports and graphs inside of Excel. Add columns of customized data to make this report even more valuable. |
![]() |
MS SharePoint Assessment. The MS SharePoint Assessment is a detailed assessment that shows the total number of sites started under management, how many active sites there are, what storage requirements there are, and includes daily trends in the number of sites and storage usage. It then takes the site collections and breaks down all the individual sites so you can understand what is being published in each, how they are organized, and even what groups they contain. Among other things, the report helps understand growth trends and helps better predict backup needs. |
![]() |
MS Teams Assessment. The MS Teams Assessment provides details about each team in the system, including who the owners are, what channels they have, and what kind of user identity audits have been conducted on the channels. There are individual entries that can be used for audits of the member settings, the guest settings, the message settings, the fun settings, and the tab settings. This information goes beyond the Microsoft security score controls and includes other types of misconfigurations that might cause security problems, such as having guest members that are able to remove and delete channels. |
![]() |
MS OneDrive Usage Report. The MS OneDrive Usage Report provides a high-level summary of all OneDrive usage. This is critical to know, since it includes every user the system has, all the Teams, and all the sites created by the client. This overview report gives you a solid handle on how the OneDrive platform is growing. It also looks for spikes in that growth that need to be managed and spikes in activity that may need to be investigated. The report provides trends over of 30-, 60-, and 90-day increments to give you a solid indicator of storage and bandwidth utilization. |
![]() |
MS OneDrive Usage Excel Detail Export. We provide MSPs the ability to export into an Excel file format all of the MS OneDrive Usage detail information discovered from the scans. Once in Excel, you'll be able to take the data and import it into your favorite Service Desk or PSA system, or simply create your own custom analyses, reports and graphs inside of Excel. Add columns of customized data to make this report even more valuable. |
![]() |
MS Outlook Mail Activity Report. The Outlook Mail Activity Report is the perfect complement to the Network Detective Exchange Assessment module, which provides deep dive information about Microsoft 365 Exchange service usage. The Outlook Mail Activity Report provides a high-level summary of what emails are being sent and received by your top 10 active senders and active receivers for the reporting period. This report is meant to be run month-over-month to identify the power users who may need more capacity, and which mailboxes are not being read at all and represent recently inactive users that need to be cleaned up. |
![]() |
MS Outlook Usage Excel Detail Export. We provide MSPs the ability to export into an Excel file format all of the MS Outlook Usage detail information discovered from the scans. Once in Excel, you'll be able to take the data and import it into your favorite Service Desk or PSA system, or simply create your own custom analyses, reports and graphs inside of Excel. Add columns of customized data to make this report even more valuable. |
![]() |
MS Cloud Compensating Control Worksheet. The report is used to present the details associated with security exceptions and how Compensating Controls will be or have been implemented to mitigate risks in the cloud environment. Here you can document and explain why various discovered items are not true issues and are possible false positives. The benefit of this feature is that it adds the human element back into the assessment and allows for explanation of special circumstances and specific environment requirements. The Compensating Controls Worksheet does not alleviate the need for safeguards but allows for the description of alternative means of mitigating the identified security risk. |
![]() |
MS Configuration Change Report. The Configuration Change Report is a very detailed technical report that identifies entity and configuration changes. The changes are grouped by properties, showing the old values versus the new values, and then grouped together into bands called “Change Sets.” This report gives you the ability to look at a group of changes together, as well as see how all the properties have changed for that particular time period. This is useful for change management and for capturing and documenting unwanted changes in the event you need to roll back those changes in the user interface. |
![]() |
Exchange Risk Report. While the Exchange Assessment module will automatically generate the detailed reports you need to manage a full migration project - or deliver an on-going security and maintenance service - you might not want to share all that information with your clients. Instead, show them a branded high-level report. Designed specifically to be a customer-facing document, this report provides a polished overview of any issues identified in the more detailed reports. Corresponding charts and graphs clearly communicate issues and serve as a graphical aide to help suggest remedial steps. This is the perfect report to prepare for your account reviews for current customers to show that you are properly handling their Exchange environments. And, it's a fabulous report to run for new prospects to show potential deficiencies and risks that you can help cure and manage. |
![]() |
Exchange Management Plan. This report will help prioritize issues based on the issue's risk score. A listing of all affected computers, users, or sub-systems are provided along with recommended actions. |
![]() |
Exchange Assessment PowerPoint. Use our generated PowerPoint presentation as a basis for conducting a meeting presenting your findings from the Network Detective. General summary information along with the risk and issue score are presented along with specific issue recommendations and next steps. |
![]() |
Exchange Traffic and Use Report. Managing individual and aggregate mailbox sizes is a real challenge for most organizations. It's obviously important to understand the total organizational email traffic and usage in order to prepare for a migration project. But the report is equally useful on an ongoing basis to help manage individual mailbox size limits based on usage needs, and to identify individuals who may be misusing or abusing their mailboxes. This report will show you the status of all mailboxes - their size limits, percentage used, and percentage free. This report is extremely useful when planning a migration or for growth planning to ensure that systems will continue to run without interruption. |
![]() |
Exchange Mailbox Detail Report. Without this tool, it would be a daunting task to ask someone to document all known and available information for every mailbox in an Exchange environment. With the Exchange Assessment module, it's quick and painless. Simply run the non-invasive scan on the target Exchange Server, and Network Detective does the rest. This report gives you a mailbox-by-mailbox catalog of information, including everything from mailbox display name to quotas to a listing of folders/sizes for each mailbox (and more). Whether documenting regular use, planning ahead, or preparing for a migration - knowledge is power and, in this case, knowledge can be money as well. This report will allow you to better prepare for a migration by knowing all mailbox settings, ensure that display names, etc., are standardized, quotas are set appropriately, and also trouble-shoot issues with specific mailboxes. |
![]() |
Exchange Distribution Lists Report. Most organizations routinely create email distribution groups - both for internal communications and for routing incoming emails to multiple individuals at the same time. The problem is that over time, many companies lose track of which groups they've created and who's included in them. Obviously, with a migration you'd want to be able to accurately replicate all of these groups. But how about all those situations when employees turn over or change positions? Each time this happens individual emails need to be systematically added and removed from groups. This report identifies and lists all distribution groups as well as which end-users or other groups are to receive any emails. |
![]() |
Exchange Mailbox Permissions Report by Mailbox. Sometimes there's a need to give one or more individuals permission to access either someone else's mailbox, or a group mailbox, on a temporary basis - vacations, leaves of absence, and terminations are all examples of this situation. For security purposes, best practices suggest a periodic review of all mailboxes This report will identify on a mailbox-by-mailbox basis which groups or which individuals have access to the mailbox and at what level. |
![]() |
Exchange Mailbox Permissions Report by User. A separate companion report inverts the information to show you on a user-by-user basis which users have access to which mailboxes. This report is a great way to document individual access rights. |
![]() |
Exchange Excel Export. We also give you the ability to output all of the Exchange data configurations uncovered by our scan, and export it into an Excel file format. Once in Excel, you'll be able to take the data and import it into your favorite Service Desk or PSA system, or simply create your own custom sorts, analyses, reports and graphs inside of Excel. |
![]() |
Exchange Mobile Device Report. Whether users are provided with a company sanctioned mobile device or are given the ability to "bring their own device", it is important to know all the details of the network's techno-diversity. This report provides a detailed listing of every mobile device used by employees to access their organization's mailbox. The report indicates the names and specific types of mobile devices that are accessing the Exchange server, as well as the operating systems and even the number of folders that are being updated. This report will help optimize employee connectivity/productivity and plan appropriately for system changes/upgrades. The report is also useful to present to clients as an aid to support your case as for system changes (such as setting up a SharePoint portal, moving to Exchange 2011, etc.). |
![]() |
Server Health Report. This report details the overall risk to the environment measured by the number of issues detected. An ideal environment would have a Health Score of 0 (indicating no risks found). The higher the score, the more likely a security, availability, or performance related incident will occur. |
![]() |
Routine Health Report. This report assesses the health of the SQL Server using three major categories. These include settings, file, and resources. Setting health looks for configuration issues that may go against prescribed best practices. File health looks at how the database interacts with the file system, looking for adequate space and compares the current configuration versus best practices. Resource health looks to ensure adequate resources are available to operate the SQL Server optimally and looks for indicators pointing to performance issues. Resource health comprises of three sub-categories – wait health, task health, and memory health. Wait health deals with issues with database processing waits and delays. Task health validates that scheduled tasks and jobs are working optimally. Memory health looks to ensure adequate memory is available to run the SQL Server properly. |
![]() |
SQL Server Detail Report. This report details the settings and health of the SQL Server as a whole. It looks at settings, configuration, performance, and backup. Information and detailed breakdown of databases can be found in the Database Detail report. |
![]() |
Database Detail Report. This report details the settings and health of individual databases that reside on the scanned SQL Server. It lists the database properties, potentially missing indexes, locks, statistics, fragmentation, and existing indexes. Without this tool, it would be a daunting task to collect all this information. Because this report documents each database individually, it can be run ad-hoc when specific database performance problems arise. But best practice is not to wait and react to these problems but plan to run this report on a regular basis (quarterly or monthly, depending upon the how critical the application is). This report will help identify opportunities to improve performance and accumulate trending data that will help you anticipate problems before they occur. The report is also a great way to document your work for both internal and external uses. |
![]() |
Maintenance Plan Report. This report details all maintenance plans and their sub-plans. Maintenance plans perform routine tasks on your SQL Server. Not all maintenance plans are active and in-use, and you can use the report to document what’s in place and if adequate automation of maintenance and backups are being performed. |
![]() |
SQL Server Agent Jobs Report. This report details all jobs (active and inactive) for the SQL Server agent. Some jobs may be maintenance plans and can be seen in detail in the Maintenance Plan Detail report (see above). Look in the Job History section of this report for entries in RED or that do not say "success" and see what jobs are causing errors and why. This report is so simple to generate, even non-DBA tech can use it to check for errors in jobs. And since some Remote Monitoring and Management (RMM) tools do not delve into the actual database level, it makes sense to run this report monthly to supplement your RMM tool, and also to keep it "honest." |
![]() |
Executive Summary. The Executive Summary report displays the potential risk across standard business categories as well as the potential liabilities discovered within the network. |
![]() |
Data Breach Liability Report. Use this infographic to demonstrate the financial exposure levels and personal identifiable information (PII) risks on the organization’s network. It also shows the potential financial risk in the event of a breach and what can be done to reduce the chance of a compromise. |
![]() |
Dark Web ID Scan Summary. This report provides a risk assessment of domains and email addresses that may have been compromised on the dark web. For each compromised login, the report details how recently a password reset has been performed. This allows readers to quickly understand where immediate action is required. (Requires active subscription to Dark Web ID.) |
![]() |
Password Policies Summary. This report details inconsistencies with computer password policies and shows which end-users are not in compliance with those policies. Most often business have poor policy enforcement which poses a risk to the organization's IT infrastructure. |
![]() |
Outdated Malware Definitions Monitoring Report. This report provides a risk assessment of computers and servers running outdated security definitions. Computers and servers logged into most recently are surfaced in the report. This allows readers to quickly understand where immediate action is required. |
![]() |
Outdated Operating Systems Monitoring Report. This report provides a risk assessment of computers and servers running an outdated operating system. For the most common operating systems, the report details which operating system is currently in use. This allows readers to quickly understand where immediate action is required. |
![]() |
Server and Workstations Aging Report. The age of hardware in your environment can directly affect your availability and performance. As hardware gets older, the risk of failure increases. This report analyzes the age of servers in the environment. |
![]() |
Vulnerability Scan Assessment Summary . The Vulnerability Scan Assessment Summary presents the latest scan results from VulScan. This single page infographic report details the issues and the severity of the vulnerabilities found. Protecting your uptime and proactively removing hacker footholds is beneficial for the business' endpoint productively and employee morale. (Requires active subscription to VulScan). |
![]() |
Compliance Baseline Assessment Summary. This single page infographic report presents results from the Rapid Baseline Assessment for communication and prospecting purposes. The Compliance Manager GRC Rapid Baseline Assessments allow users to quickly identify gaps where you are not compliant with the law. Each report can display a high level baseline compliance assessment chart for up to three different standards. (Requires active subscription to Compliance Manager GRC). |
![]() |
Consolidated Risk Report. This report presents a consolidated view of your client’s overall risk score based on the scans that have been performed, along with simple charts to show the problem areas. Each problem area represents an opportunity for you to present a proposed solution and pitch your services. The purpose of this report is for you to present a total view to use as a "discussion document" in conversations with your customer about the specific risk areas you found, what they mean, and how you can help. |
![]() |
Consolidated Management Plan. The Consolidated Management Plan provides a total view of all issues. This information helps MSP’s and IT Technicians prioritize issues based on each issue's risk score. It also provides a total listing of all affected computers, users, or sub-systems provided along with recommended remediation actions. |
![]() |
Consolidated Security Report Card. This report presents a consolidated view of your client’s overall risk score based on the scans that have been performed, along with simple charts to show the problem areas. Each problem area represents an opportunity for you to present a proposed solution and pitch your services. The purpose of this report is for you to present a total view to use as a "discussion document" in conversations with your customer about the specific risk areas you found, what they mean, and how you can help. |
![]() |
Client Progress Report. The Progress Report allows users to showcase the health of the IT infrastructure. Information is delivered through easy-to-follow charts that illustrate the continuous improvements to the security profile of the business and can validate the need for additional resources. Users can customize the documents by including or excluding sections, changing text, and adding boilerplates. The Progress Report is available for users with subscriptions to the Network Detective Pro. |